Comparison of simulated monthly means with the GPCC dataset in a study area
Objectives
There is a need to use long-term time series of precipitation with good spatial coverage to verify the amounts of groundwater recharge and surface runoff. A short-term time series of 5 years would lead to a tremendous uncertainty in forecasting the mean. In order to decrease the uncertainty, a time series of more than 20 years should be taken into account. However, there is no way to achieve a long-term time series with good spatial coverage using ground-based point measurements. Typically rainfall cells are much smaller than the distances between the stations. Therefore, the application of regionalization methods (for example THIESSEN polygons) will lead to a misunderstanding of the precipitation properties. The ground-based point measurement of rainfall at stations is not necessarily representative for larger areas.
Method
To overcome the difficulty of the invalid regionalization of the ground-based rainfall measurement, a precipitation simulation approach can be uses. The so-called space-time precipitation simulator is a stochastic model with hierarchical design. The first step is for a MARKOV-chain to determine whether the day is dry or whether there was rainfall somewhere in the region (wet day). If a day is considered wet, then rainfall occurrences and amounts were simulated simultaneously for each grid point. The rainfall occurrence is a function of the long-term monthly rainfall of the given location (climatology). The simulated rainfall amounts for each location are supposed to follow an exponential distribution with the parameters dependent upon the climatology. The spatial extent and correlation between the locations is the result of the simulation of spatially dependent random fields. The simulation takes into account the precipitation properties (such as relative monthly frequency of rainy days, intensities, and amounts) of the ground-based measurements. The length of the simulated time series is defined by the users. The precipitation data is presented as gridded information within a cell size of 9,976.6 m x 9,976.6 m. Due to the stochastic approach, the simulated time series are not conditional to the measured times series of a location. Therefore, a target-oriented comparison has to focus upon measured properties like:
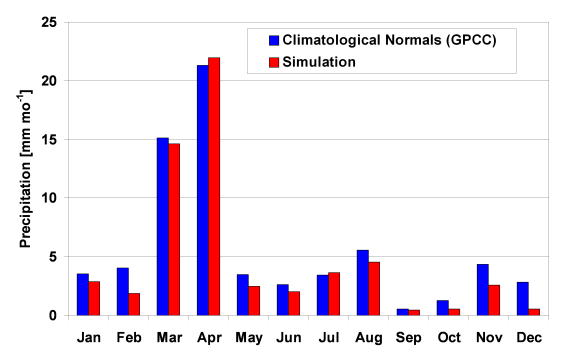
The seasonality is checked with calculated monthly means for the complete area. The figure above shows the comparison of the simulated monthly means with the GPCC dataset. In accordance with the climatological normals, the simulation reproduces the annual change. Rich rainfall is focused on the period between March and April, with the maximum occurring in April. Between September and December there is only some rainfall. The simulation matches the measured seasonality of rainfall very well. The number of simulated rainy days for the example above yields an average of 9.21 days per year. The analysis of the measurements at the rainfall stations in the area yields a figure of 8.6 rainy days per year, very close to the simulated values. Therefore, the precipitation simulation matches the number of the measured rainy days.
There is a need to use long-term time series of precipitation with good spatial coverage to verify the amounts of groundwater recharge and surface runoff. A short-term time series of 5 years would lead to a tremendous uncertainty in forecasting the mean. In order to decrease the uncertainty, a time series of more than 20 years should be taken into account. However, there is no way to achieve a long-term time series with good spatial coverage using ground-based point measurements. Typically rainfall cells are much smaller than the distances between the stations. Therefore, the application of regionalization methods (for example THIESSEN polygons) will lead to a misunderstanding of the precipitation properties. The ground-based point measurement of rainfall at stations is not necessarily representative for larger areas.
Method
To overcome the difficulty of the invalid regionalization of the ground-based rainfall measurement, a precipitation simulation approach can be uses. The so-called space-time precipitation simulator is a stochastic model with hierarchical design. The first step is for a MARKOV-chain to determine whether the day is dry or whether there was rainfall somewhere in the region (wet day). If a day is considered wet, then rainfall occurrences and amounts were simulated simultaneously for each grid point. The rainfall occurrence is a function of the long-term monthly rainfall of the given location (climatology). The simulated rainfall amounts for each location are supposed to follow an exponential distribution with the parameters dependent upon the climatology. The spatial extent and correlation between the locations is the result of the simulation of spatially dependent random fields. The simulation takes into account the precipitation properties (such as relative monthly frequency of rainy days, intensities, and amounts) of the ground-based measurements. The length of the simulated time series is defined by the users. The precipitation data is presented as gridded information within a cell size of 9,976.6 m x 9,976.6 m. Due to the stochastic approach, the simulated time series are not conditional to the measured times series of a location. Therefore, a target-oriented comparison has to focus upon measured properties like:
- long-term spatial distribution,
- seasonality,
- number of rainy days, and
- composition of the total rainfall.
The seasonality is checked with calculated monthly means for the complete area. The figure above shows the comparison of the simulated monthly means with the GPCC dataset. In accordance with the climatological normals, the simulation reproduces the annual change. Rich rainfall is focused on the period between March and April, with the maximum occurring in April. Between September and December there is only some rainfall. The simulation matches the measured seasonality of rainfall very well. The number of simulated rainy days for the example above yields an average of 9.21 days per year. The analysis of the measurements at the rainfall stations in the area yields a figure of 8.6 rainy days per year, very close to the simulated values. Therefore, the precipitation simulation matches the number of the measured rainy days.