Dichtegetriebene Grundwasserströmung in geschichteten Aquiferen
view of the testaquifer
- l x h x w : 3.54m x 0.54m x 0.17m
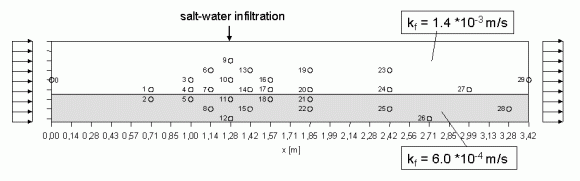
- quartz sand 1 (Ø 0.3-0.8mm), quartz sand 2 (Ø 0.1-0.4mm)
- kf1= 1.4·10-4 m/s ; kf2= 6.0·10-5 m/s
- ne1 = ne2 = 38.5%
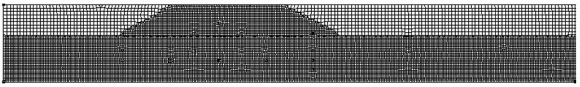
- width of the modelmesh: 2cm
- refinement to 1cm in the zone of salt-water infiltration and quartz sand 2
Boundary conditions
- top and bottom of the test aquifer impermeable, except the infiltration poin t of the high concentrated Salt water
- gradient between left and right boarder: 4cm
- infiltration rate of salt water: Q = 1.89·10-6 m³/s
- duration of salt water infiltration: 90 minutes
- salt water concentration: 140 g/l natriumchlorid
Objectives
Laboratory Experiments
2D Testaquifer
3D Testaquifer
Modeling
2D Testaquifer
3D Testaquifer
Breaktrough Curves
2D Laboratory Experiments
2D Modeling
Movies
2D Modelling
3D Modelling